Navigation
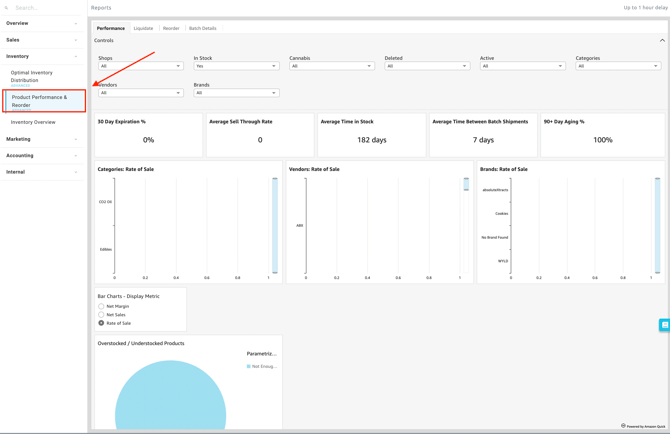
Insights > Dashboard > Inventory > Product Performance & Reorder
This dashboard is broken down into the following four sections:
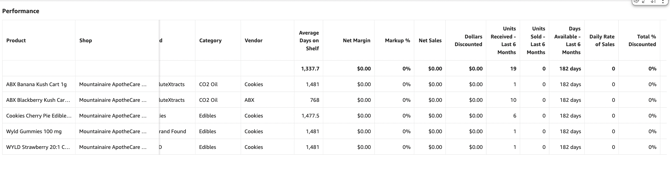
Performance Section
This section allows you to evaluate how quickly your products are moving and gauge overall inventory health by analyzing sell-through rates, average time in stock, and identifying overstocked or understocked items.
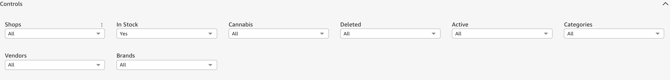
Filtering Report Data
You can easily customize the data displayed on your dashboard by selecting the following filter options at the top of the page.
-
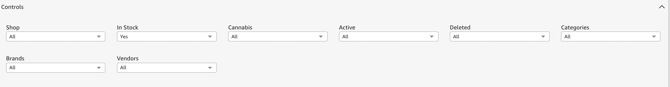
Controls:
-
-
Shop(s): Select the specific location(s) you want to view.
-
In stock: Filters data based on current inventory availability (e.g., viewing only items currently on hand).
-
Cannabis: Filters products based on whether they are regulated cannabis items or non-cannabis accessories/merchandise.
-
Deleted: Includes or excludes products that have been removed or deactivated from your system.
- Active: Includes or excludes currently active products in your catalog.
- Categories: Filters data by product classifications or types.
- Vendors: Filters data based on the supplier or distributor that provided the products.
- Brands: Filters data by specific product manufacturers or brand names.
-
Dashboard Metrics & Reports
Key Metrics
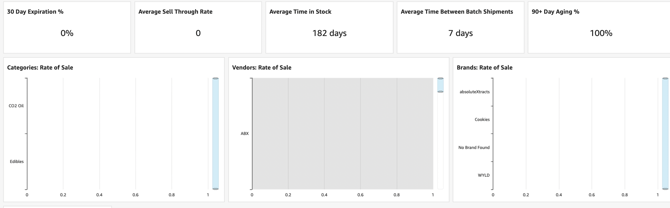
- 30 Day Expiration %: The percentage of current inventory expected to expire within the next 30 days.
- Average Sell Through Rate: The rate at which inventory is sold relative to the amount of inventory received.
- Average Time in Stock: The average number of days a product sits in inventory before being sold.
- Average Time Between Batch Shipments: The average number of days between receiving new inventory batches for a product.
- 90+ Day Aging %: The percentage of your total inventory that has been sitting in stock for more than 90 days.
Available Reports & Charts
-
Categories: [ Display Metric ]: Visualizes your selected performance metric broken down by product category.
-
Vendors: [ Display Metric ]: Visualizes your selected performance metric broken down by vendor.
-
Vendors: [ Display Metric ] Bar Chart: A bar chart representation of your selected metric distributed by vendor.
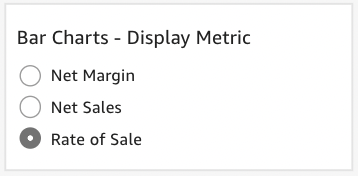
- Bar Charts - Display Metric
-
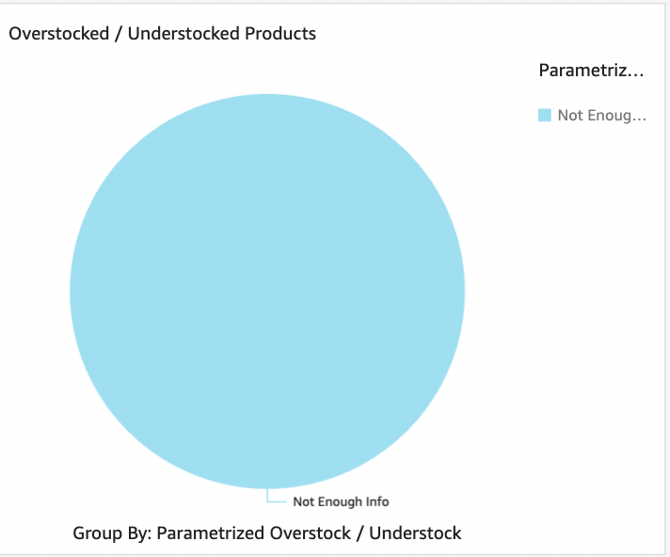
Overstocked / Understocked Products: Highlights specific items where current inventory levels significantly exceed or fall short of optimal stock levels.
-
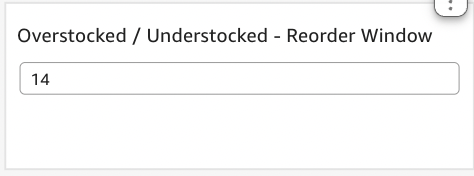
Overstocked / Understocked - Reorder Window: Displays inventory health specifically mapped against your purchasing timelines to identify urgent ordering needs or excess stock issues.
-
-
Performance: Displays inventory health specifically mapped against your purchasing timelines to identify urgent ordering needs or excess stock issues.
Liquidate Section
This section helps you pinpoint slow-moving and aging inventory, providing actionable data to help you plan markdowns, run targeted promotions, and clear out stagnant stock before it expires.
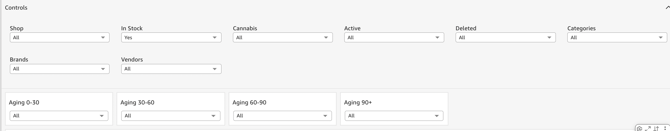
Filtering Report Data
Just like the Performance section, you can filter your delivery time metrics using the controls at the top of the page.
-
Controls:
-
Shop(s): Select the specific location(s) you want to view.
-
In stock: Filters data based on current inventory availability.
-
Cannabis: Filters products based on whether they are cannabis or non-cannabis items.
-
Deleted: Includes or excludes products that have been removed from the system.
- Active: Includes or excludes currently active products.
- Categories: Filters data by product classifications or types.
- Vendors: Filters data based on the supplier or distributor.
- Brands: Filters data by specific product manufacturers or brand names.
- Aging 0-30: Filters inventory that has been in stock for 0 to 30 days.
- Aging 30-60: Filters inventory that has been in stock for 30 to 60 days.
-
-
- Aging 60-90: Filters inventory that has been in stock for 60 to 90 days.
- Aging 90 +: Filters older inventory that has been in stock for more than 90 days.
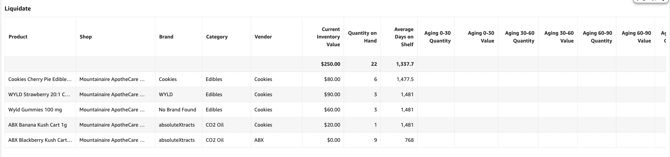
Available Reports
-
Liquidate:
-
Provides a detailed list of aging or underperforming inventory recommended for markdowns, promotions, or liquidation.
-
Reorder Section
This section streamlines your purchasing workflow by monitoring inventory days remaining, tracking vendor lead times, and suggesting optimal reorder quantities so you never run out of your top-selling products.
Filtering Report Data
You can easily customize the data displayed on your dashboard by selecting the following filter options at the top of the page.
-
Controls:
-
-
Shop(s): Select the specific location(s) you want to view.
-
In stock: Filters data based on current inventory availability.
-
Cannabis: Filters products based on whether they are cannabis or non-cannabis items.
-
Deleted: Includes or excludes products that have been removed from the system.
- Active: Includes or excludes currently active products.
- Categories: Filters data by product classifications or types.
- Vendors: Filters data based on the supplier or distributor.
- Brands: Filters data by specific product manufacturers or brand names
-
Dashboard Metrics & Reports
Key Metrics
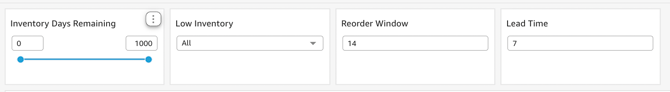
- Inventory Days Remaining: Filters products based on the estimated number of days until the current stock is entirely depleted.
- Low Inventory: Filters items that have fallen below their designated minimum stock thresholds.
- Reorder Window: Filters products based on optimal times to place a new purchase order.
- Lead Time: Filters data based on the expected turnaround time from the vendor (from order placement to delivery).
Available Reports
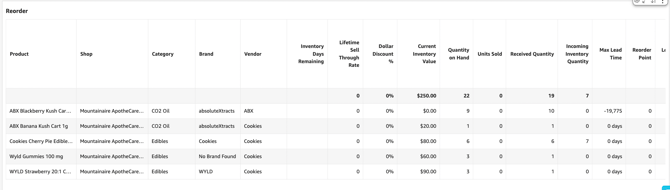
-
Reorder: Displays a comprehensive list of products that need to be restocked, including suggested reorder quantities based on sales velocity and lead times.
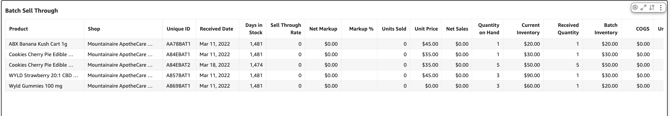
Batch Detail Section
This section provides granular visibility into your specific inventory shipments, allowing you to track exactly when intake batches were received and analyze the sell-through velocity of each individual shipment.
Filtering Report Data
Just like the Overview section, you can filter your delivery time metrics using the controls at the top of the page.
-
Controls:

-
Received Date: Define the specific timeframe for the report.
-
Categories: Filters data by product classifications or types
- Brands: Fiilters data by specific product manufacturers or brand names.
- Vendors: Filters data based on the supplier or distributor.
-
Products: Filters data by specific individual items or SKUs
-
Available Reports
-
Batch Sell Through:
-
Analyzes how quickly specific intake batches are selling over time, helping identify which specific shipments moved the fastest.
-
💡 Pro Tip: You can export this or any KPI held in Insights to a CSV or Excel file. Simply click the More Options (three-dot icon) in the upper right-hand corner of the metric.