Navigation
To access this report, follow this path in your dashboard:
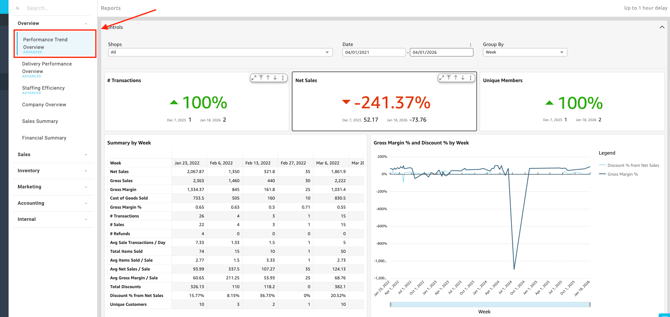
Insights > Dashboard > Overview > Performance Trend Overview
Filtering Report Data
You can easily customize the data displayed on your dashboard to fit your specific needs. Use the following filter controls to narrow down your view.
-
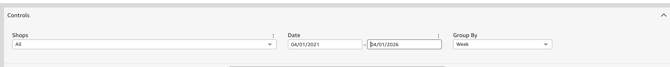
Controls:
-
-
Shop(s): Select the specific location(s) you want to view.
-
Date: Define the specific timeframe for the report.
-
Group By: Organize the report data by specific groupings (e.g., Day, Month, Quarter, Week, or Year) for customized aggregation based on duration.
-
Dashboard Metrics & Reports
The dashboard provides a comprehensive view of your sales through various Key Performance Indicators (KPIs), detailed breakdowns, and visual charts.
-
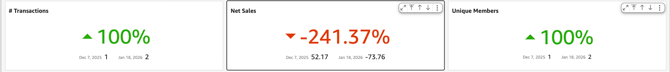
Key Metrics
- # Transactions: The total number of transactions indicating performance trends that were processed during the selected timeframe.
-
Net Sales: The percentage trend of total sales revenue generated after discounts and returns are deducted.
-
Unique Members: The total percentage of distinct customers who made a purchase.
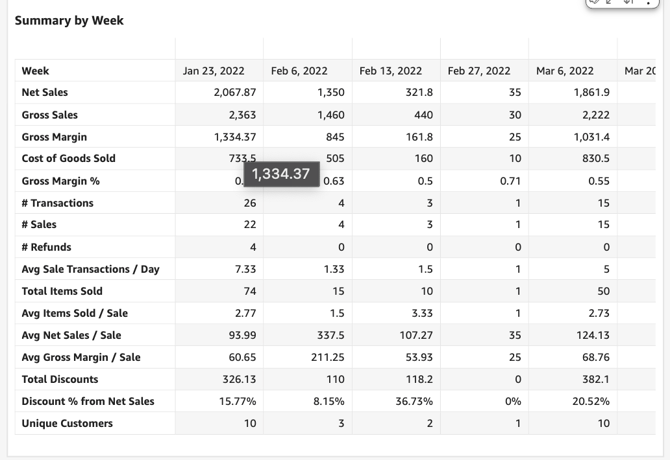
Available Reports & Charts
-
Summary By [Metric]: A breakdown summarizing your performance data.
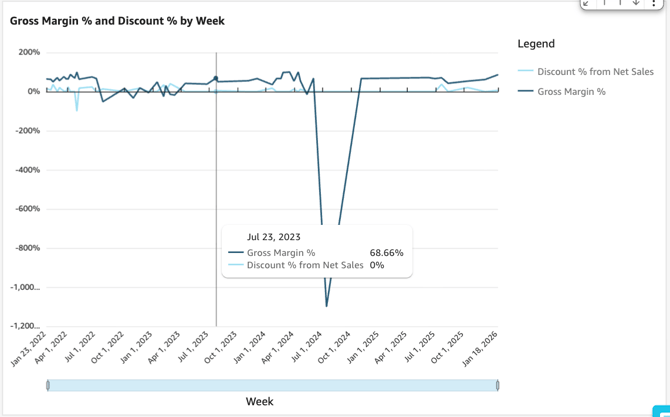
- Gross Margin % and Discount % by [Metric]: A visual representation comparing your gross margin percentage against your discount percentage.
Please review the terminology found in our Insights Accounting Glossary with your accounting professional and reach out if there are any questions!
💡 Pro Tip: You can export this or any KPI held in Insights to a CSV or Excel file. Simply click the More Options (three-dot icon) in the upper right-hand corner of the metric.