Navigation
To access this report, follow this path in your dashboard:
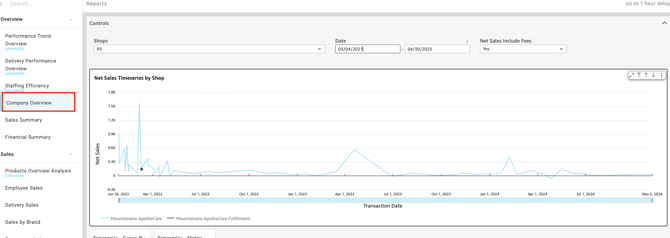
Insights > Dashboard > Overview > Company Overview
Select the following options to filter report data.
-
Controls:
-
-
Shop(s): Select the specific location(s) you want to view.
-
Date: Define the specific timeframe for the report.
-
Net Sales includes fees: Toggle between Yes or No to include or exclude fees from the net sales calculation.

-
Available Reports & Charts
-
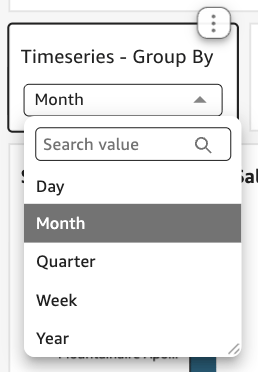
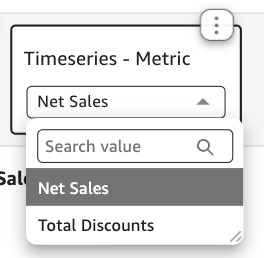
Net Sales Timeseries by Shop will offer insight into net sales data and total discounts based on the Time Series - group by and Time Series - Metrc selected.
-
Time Series - group by: will provide the sum totals of this data by duration.
-
Time Series - Metrc: will filter by Net Sales or Total Discounts.
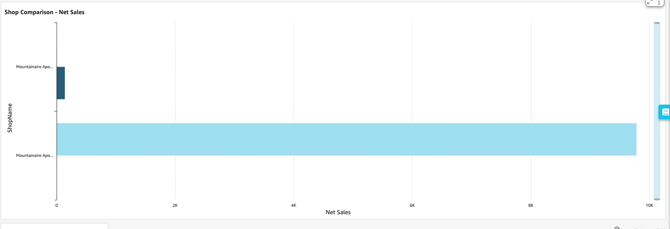
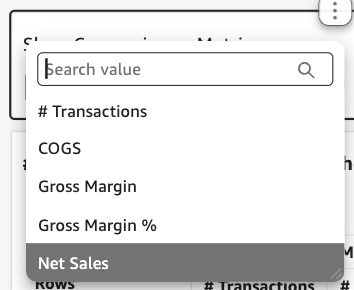
- Shop Comparison: Will offer a bar graph for shop comparison data by # of transactions, COGS, Gross Margin, Gross Margin %, and Net Sales when filtered by Shop Comparison - Metric.
.
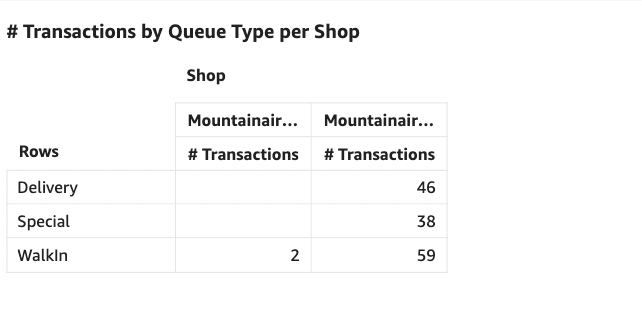
- # Transactions by Queue Type per Shop: will offer transaction data for each queue type per shop.
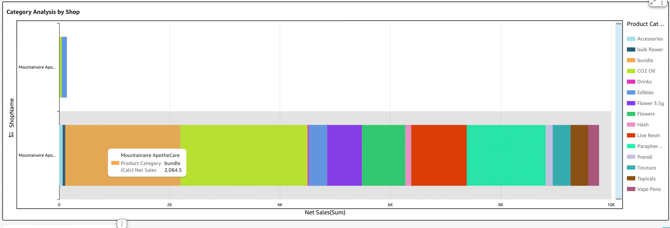
- Category Analysis by Shop: provides Net Sales graph data per category.
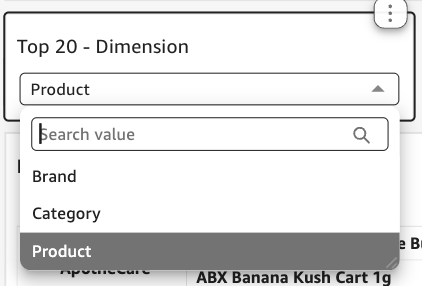
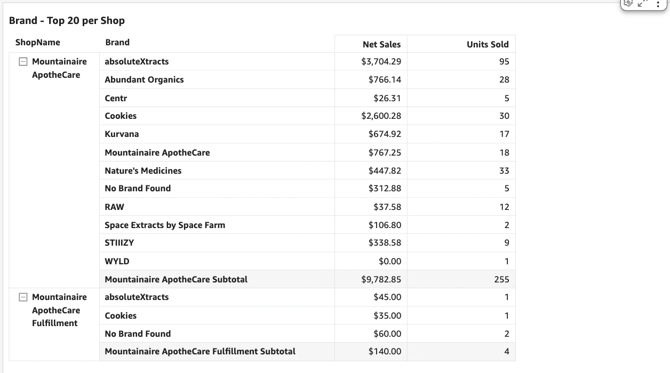
- The Top 20 per Shop: will provide relevant data for top-performing brands, categories, and products when filtered by the Top 20 - Dimension.