Navigation
Insights > Dashboard > Sales > Delivery Sales
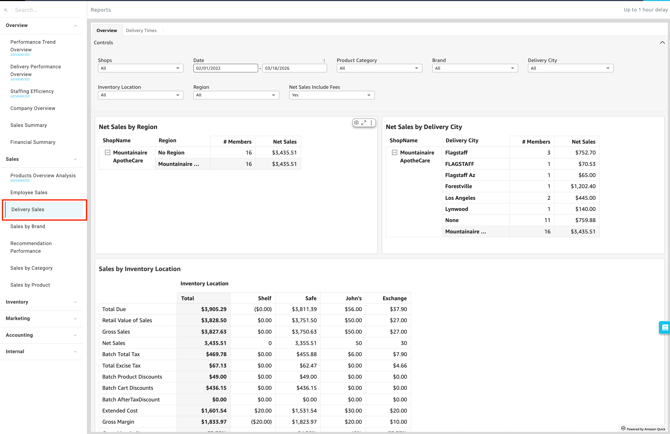
Overview Section
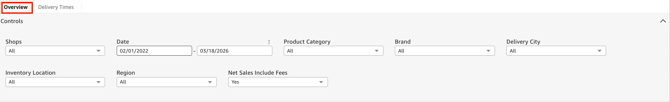
Filtering Report Data
You can easily customize the data displayed on your dashboard by selecting the following filter options at the top of the page.
-
Controls:
-
-
Shop(s): Select the specific location(s) you want to view.
-
Date: Define the specific timeframe for the report.
-
Product Category: Filter the inventory data to show sales from specific categories.
-
Brand: Filter the inventory data to show sales from specific brands.
- Delivery City: Filter your sales data by the final destination city where the members' orders were delivered.
- Inventory Location: View sales tied to the specific inventory location from which the purchased items were sold.
- Region: Segment your data by broader geographical areas.
-
Net Sales includes fees: Toggle between Yes or No to include or exclude fees from the net sales calculation.
-
Dashboard Metrics & Reports
Available Reports
-
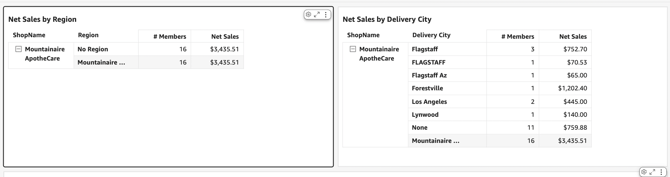
Net Sales By Region: Calculates the total revenue generated from deliveries within a broader geographic territory (a region), after deducting discounts and refunds. (Note: Based on your dashboard's toggle, this can either include or exclude delivery fees).
-
Net Sales By Delivery City: Breaks down your net revenue based on the specific destination city where orders were delivered. This helps you pinpoint your most lucrative local markets.
-
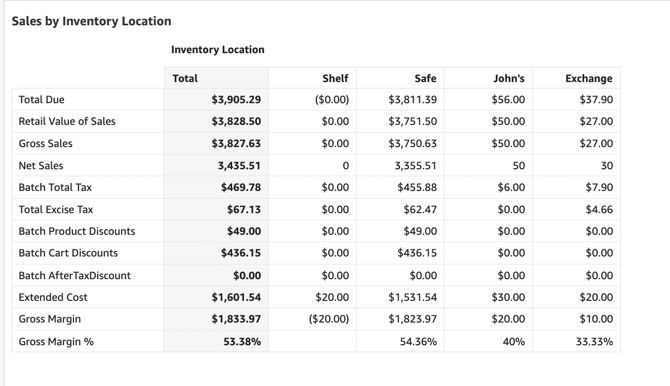
Sales By Inventory Location: Tracks the total sales volume originating from specific inventories. This helps you monitor top inventory performance.
-
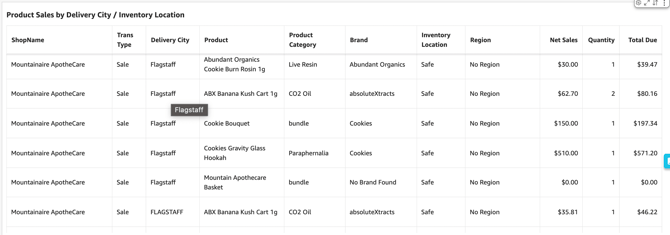
Product Sales By Delivery City / Inventory Location: A highly granular report that shows exactly which products are selling in specific cities, mapped against their respective inventory. This is incredibly useful for optimizing inventory placement so you can stock the right products closer to the customers buying them.
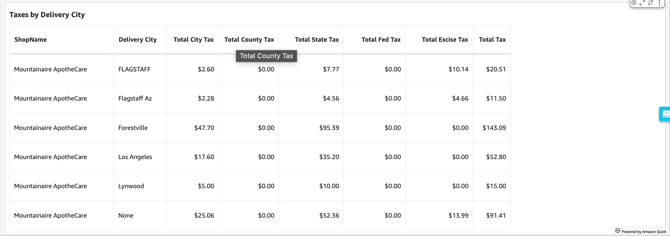
- Taxes By Delivery City: Displays the total amount of tax collected on delivery orders, categorized by the destination city. Because tax rates often vary drastically between local municipalities, this report is helpful for accurate accounting and tax compliance.
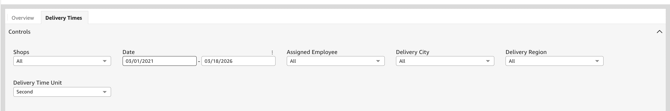
Delivery Times Section
Filtering Report Data
Just like the Overview section, you can filter your delivery time metrics using the controls at the top of the page.
-
Controls:
-
Shop(s): Select the specific location(s) you want to view.
-
Date: Define the specific timeframe for the report.
-
Assigned Employee: Filter your sales data by the specific staff member assigned to the transaction.
- Delivery City: View sales tied to the specific inventory location from which the purchased items were sold.
- Delivery Region: Segment your data by broader geographical areas.
-
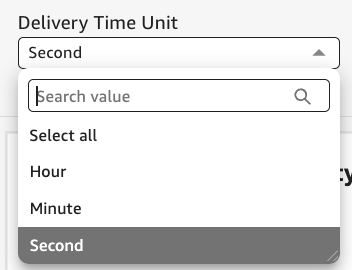
Delivery Time Unit: Filter options by Second, Minute, or Hour
-
Available Reports & Charts
-
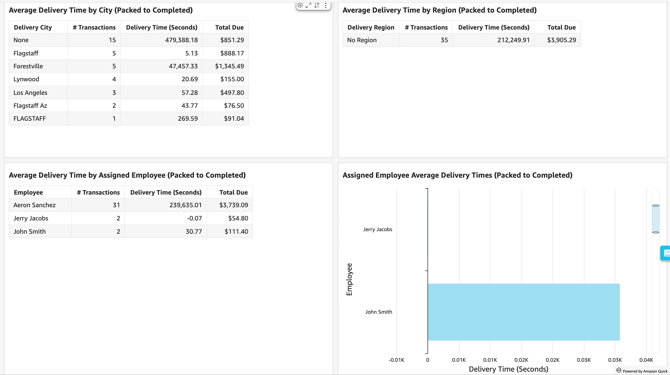
Average Delivery Time by City (Packed to Completed):
-
Calculates the average amount of time it takes for orders to be delivered within a specific municipality. The timer starts exactly when an order is marked as "Packed" at the facility and ends when the driver marks it as "Completed," helping you identify local logistical bottlenecks.
-
-
Average Delivery Time by Region (Packed to Completed):
-
Measures your fulfillment speed across a broader geographic zone. By tracking the average time from "Packed" to "Completed" on a regional level, you can assess macro-level logistics and compare efficiency between different larger territories.
-
-
Average Delivery Time by Assigned Employee (Packed to Completed):
-
Evaluates the overall average delivery speed of your workforce. This metric looks at the time elapsed between packing and completion based on who is assigned to the delivery, allowing you to gauge general staff efficiency.
-
-
Assigned Employee Average Delivery Times (Packed to Completed):
-
Provides a granular breakdown of individual driver performance. This report isolates the average "Packed to Completed" times for specific employees, making it easy to identify top performers or see who might benefit from route optimization training. (Note: While similar to the metric above, this report typically displays a comparative list or chart of each individual driver's stats).
-
-
Delivery Details:
-
Provides a comprehensive, granular log of individual delivery trips. Rather than showing aggregated averages, this detailed ledger breaks down each specific order, displaying exact timestamps (like when it was packed versus completed), the assigned employee, transaction #, and destination. This is ideal for auditing specific transactions, investigating delivery anomalies, or handling individual customer inquiries.
-
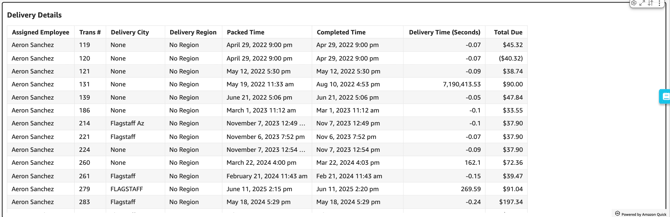
💡 Pro Tip: You can export this or any KPI held in Insights to a CSV or Excel file. Simply click the More Options (three-dot icon) in the upper right-hand corner of the metric.