Navigation
To access this report, follow this path in your dashboard:
Insights > Dashboard > Marketing > Discounts Overview
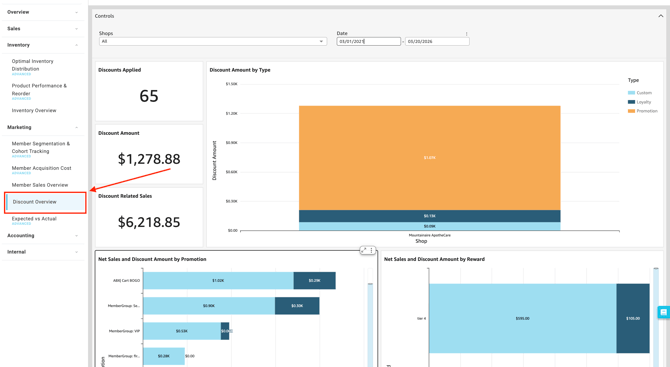
Filtering Report Data
You can customize the data displayed on your dashboard by selecting the following filter options.
-
Controls:

-
-
Shop(s): Select the specific location(s) you want to view.
-
Date: Define the specific timeframe for the report.
-
Dashboard Metrics & Reports
The dashboard provides a comprehensive view of your sales through various Key Performance Indicators (KPIs), detailed breakdowns, and visual charts.
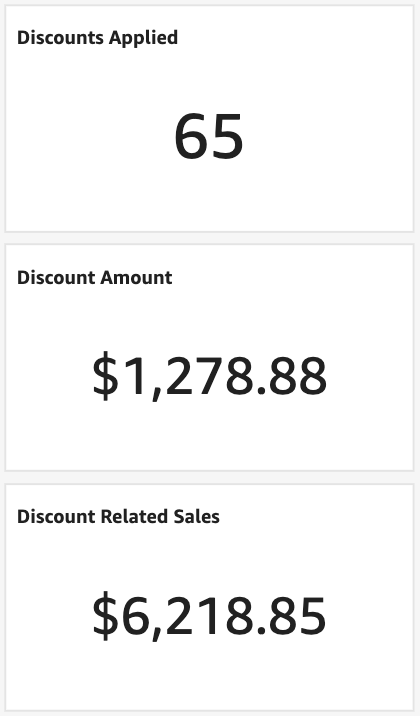
Key Metrics
-
Discounts Applied:
- The total count of times a discount was used during the selected timeframe.
-
Discount Amount:
-
The total dollar value of all discounts applied. This includes both Pre-Tax Discounts and After-Tax Discounts.
-
-
Discount Related Sales:
-
- The total net sales revenue generated from transactions where a discount was applied.
Charts & Visualizations
-
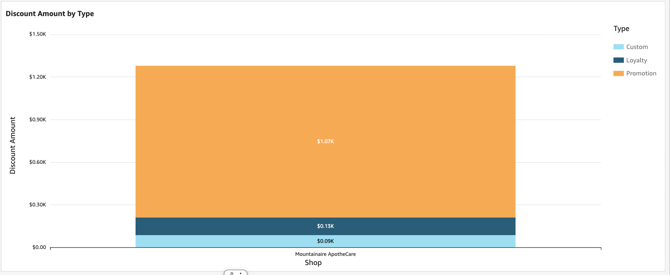
Discount Amount by Type: A visual breakdown identifying which discount categories (e.g., Promo Codes vs. Loyalty Rewards) are contributing most to your total discount amount.
-
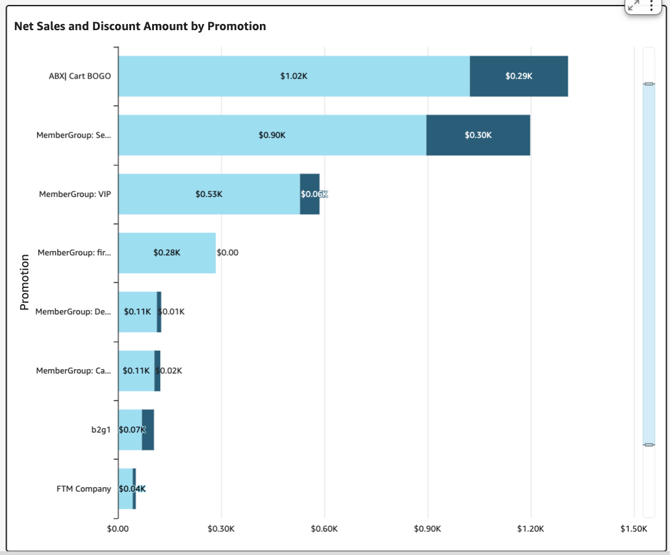
Net Sales and Discount Amount by Promotion: A chart comparing specific marketing campaigns so you can evaluate which promotions are driving the most volume to positively impact your Net Sales, versus simply eating into margins.
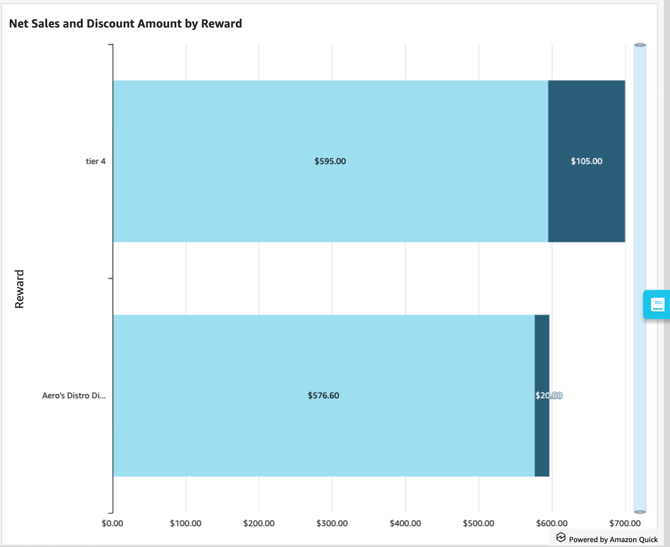
- Net Sales and Discount Amount by Reward: A visual evaluation of your loyalty program, showing whether returning customers are spending enough to justify the rewards they redeem.
Please review the terminology found in our Insights Accounting Glossary with your accounting professional and reach out if there are any questions!
💡 Pro Tip: You can export this or any KPI held in Insights to a CSV or Excel file. Simply click the More Options (three-dot icon) in the upper right-hand corner of the metric.