Navigation
To access this report, follow this path in your dashboard:
Insights > Dashboard > Overview > Staffing Efficiency

Filtering Report Data
You can customize the data displayed on your dashboard by selecting the following filter options.
Controls:

-
Shop(s): Select the specific location(s) you want to view.
-
Date: Define the specific timeframe for the report.
-
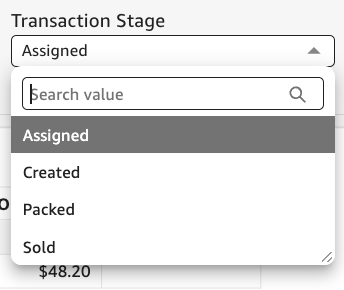
Transaction Stage: Select which stage of the transaction you wish to assess.
Filter options by:-
Assigned
- Created
- Packed
- Sold
-
-
Queue Types: Segment your report data by the specific checkout method used (e.g., Walk-In, Pickup, Special, or Delivery).
- Delivery Zip Code: Filter your data by the zip code where the members' orders were delivered.
- Delivery City: Filter your data by the final destination city where the members' orders were delivered.
- Regions: Segment your data by broader geographical areas.
Available Charts & Reports
-
Sold Employee - Hourly Efficiency by Day of Week
- Tracks individual or team performance on an hourly basis throughout the week, helping you identify when your staff is most productive.
-
Staffing Day of Week Heatgrid - # Transactions and transaction time
- Visualizes the busiest days of the week based on transaction volume and processing speed, making it easy to spot weekly trends and peak hours.
-
Staffing Dates - Heatgrid - # Transactions and Transaction Time
- Highlights specific calendar dates with high transaction volumes and processing times, which is highly useful for historical trend analysis and seasonal planning.

💡 Pro Tip: You can export this or any KPI held in Insights to a CSV or Excel file. Simply click the More Options (three-dot icon) in the upper right-hand corner of the metric.