Navigation
To access this report, follow this path in your dashboard:
Insights > Dashboard > Sales > Employee Sales
Filtering Report Data
-
You can customize the data displayed on your dashboard by selecting the following filter options.
Controls:
-
Shop(s): Select the specific location(s) you want to view.
-
Date: Define the specific timeframe for the report.
-
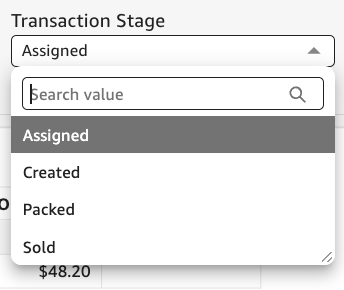
Transaction Stage: Select which stage of the transaction you wish to assess.
Filter options by:-
Assigned
- Created
- Packed
- Sold
-
-
Net Sales includes fees: Toggle between Yes or No to include or exclude fees from the net sales calculation.
Available Reports
-
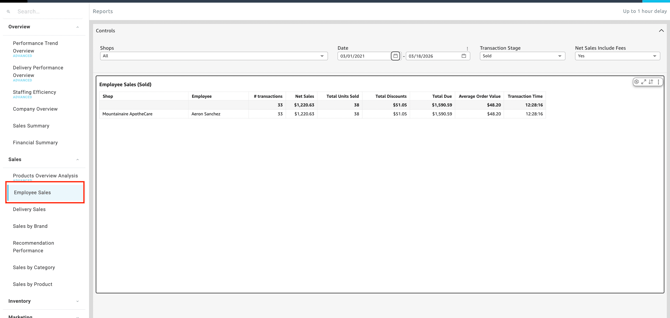
Employee Sales
The Employee Sales dashboard includes a comprehensive breakdown of orders by employee.

Budtender Performance Metrics
-
Below the shop-level KPIs, you will find the detailed budtender table. You can analyze individual employee performance utilizing the following metrics:
| Metric | Description |
| # of Transactions | Total number of transactions processed by the employee. |
| Net Sales | Total revenue after refunds (and optionally fees, based on your filter). |
| Total Units Sold | The absolute number of individual items sold by the employee. |
| Total Discounts | The monetary value of discounts applied by the employee. |
| Total Due | The final amount owed/collected for the transactions. |
| Average Order Value | The average amount spent per transaction. |
| Transaction Time | The average time taken by the employee to complete a transaction. |
Shop-Level KPI Overview
-
Located just above the main budtender table is a 9-tile shop-level KPI row. This section gives you an immediate snapshot of the shop's overall performance based on your selected filters:
| KPI Tile | Description |
| Total Sales (Net) | The total net revenue generated by the shop. |
| Total Orders | The total count of completed orders. |
| Avg AOV (Net) | The average net order value across all transactions. |
| Avg Order Time | The average duration it takes to process and complete an order. |
| Avg Wait Time | The average time a customer spends waiting before being served. |
| Avg Items / Order | The average number of individual products sold per transaction. |
| Avg Discount % | The average percentage of discounts applied across all orders. |
| Avg Discounts / Order | The average monetary value of discounts applied per order. |
| Total BLAZEPAY Tips | The total amount of tips collected via BLAZEPAY transactions. |
- *Note: Redshift Migration - This dashboard has been successfully migrated to our new Redshift data platform with near-perfect data parity, while the user experience remains unchanged.
💡 Pro Tip: You can export this or any KPI held in Insights to a CSV or Excel file. Simply click the More Options (three-dot icon) in the upper right-hand corner of the metric.