Navigation
To access this report, follow this path in your dashboard:
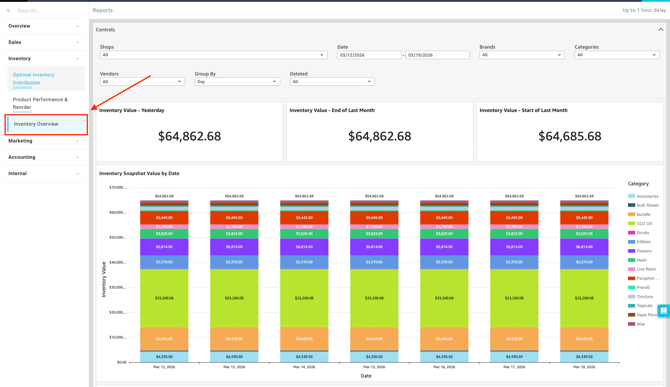
Insights > Dashboard > Inventory > Inventory Overview
Filtering Report Data
You can easily customize the data displayed on your dashboard to fit your specific needs. Use the following filter controls to narrow down your view.
-
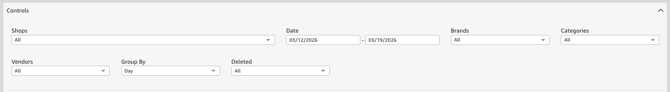
Controls:
-
Shop(s): Select the specific location(s) you want to view.
-
Date: Define the specific timeframe for the report.
-
Brands: Filter the inventory data to show items from specific brands.
- Categories: Narrow down the view to specific product types or categories.
- Vendors: View inventory supplied by specific distributors or vendors.
- Group By: Organize the report data by specific groupings (e.g., Day, Month, or Week) for customized aggregation based on duration.
- Deleted: Toggle to include or exclude deleted, inactive, or archived inventory items in the report.
-
Dashboard Metrics & Reports
The dashboard provides a comprehensive view of your sales through various Key Performance Indicators (KPIs), detailed breakdowns, and visual charts.
-
Key Metrics
-
-
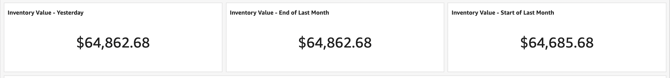
Inventory Value - Yesterday: The total financial value of your on-hand inventory at the close of the previous business day.
-
Inventory Value - End of Last Month: The total financial value of your inventory at the close of the previous calendar month.
-
Inventory Value - Start of Last Month: The total financial value of your inventory at the beginning of the previous calendar month.
-
Available Reports & Charts
-
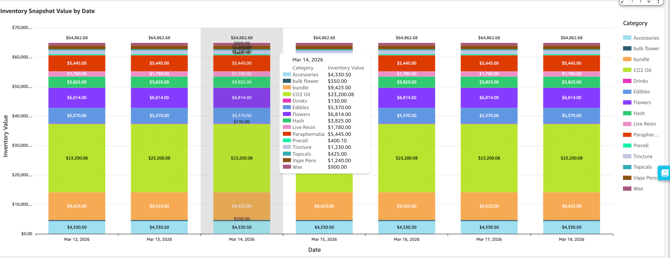
Inventory Snapshot Value by Date: A visual trend chart showing the total value of your on-hand inventory over your selected timeframe, helping you track valuation fluctuations.
-
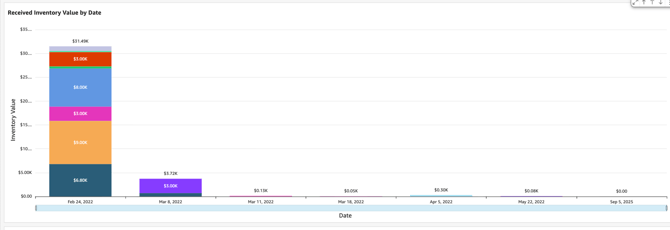
Received Inventory Value by Date: A chart displaying the total monetary value of incoming stock received into the system on specific dates.
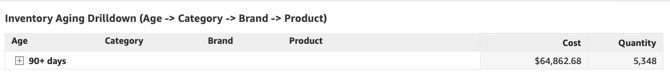
- Inventory Aging Drilldown (Age -> Category -> Brand -> Product): Drill down from the age of the inventory to the specific category, brand, and individual product to easily identify slow-moving items.
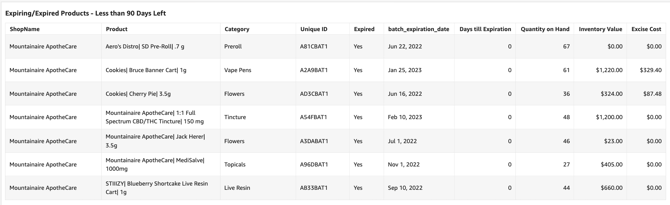
- Expiring/Expired Products - Less than 90 Days Left: A critical report highlighting perishable items that have already passed their expiration date or will expire within the next 90 days, aiding in shelf-life management.
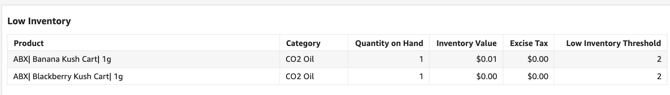
- Low Inventory: A list of flagged items that have dropped below their designated threshold levels, signaling that it is time to reorder to prevent them from showing out of stock.
💡 Pro Tip: You can export this or any KPI held in Insights to a CSV or Excel file. Simply click the More Options (three-dot icon) in the upper right-hand corner of the metric.