Navigation
To access this report, follow this path in your dashboard:
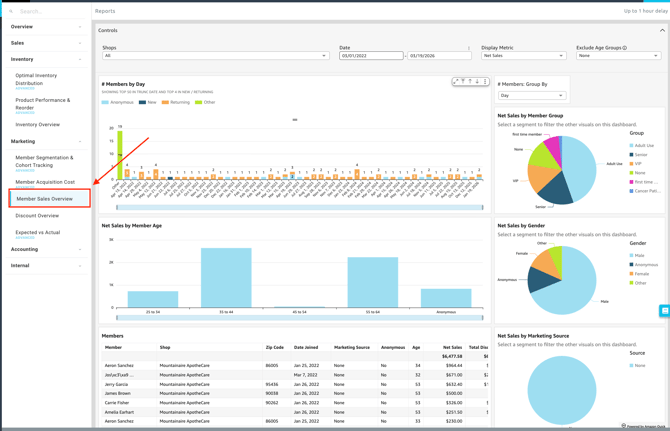
Insights > Dashboard > Marketing > Member Sales Overview
Filtering Report Data
You can customize the data displayed on your dashboard by selecting the following filter options.
-
Controls:

-
Shop(s): Select the specific location(s) you want to view.
-
Date: Define the specific timeframe for the report.
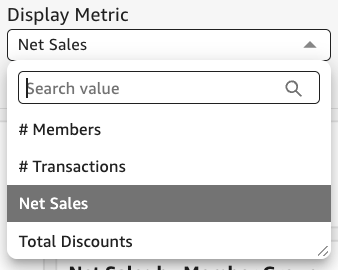
- Display Metric: Choose which primary value to display across your charts, such as # of Transactions, # of Members, Net Sales, or Total Discounts.
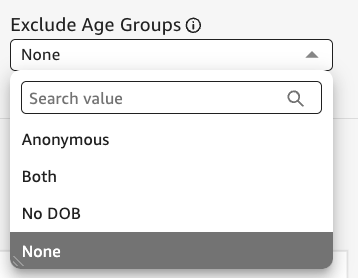
- Exclude Age Group: Filter out specific age brackets to focus your analysis on your target demographics, such as anonymous members, no date of birth, or both.
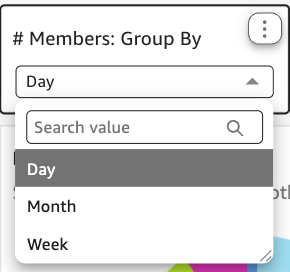
- # Members group by: Organize the total member count by specific attributes, such as day, month, or week, for any duration.
Dashboard Metrics & Reports
The dashboard provides a comprehensive view of your sales through various Key Performance Indicators (KPIs), detailed breakdowns, and visual charts.
Detailed Breakdowns
-
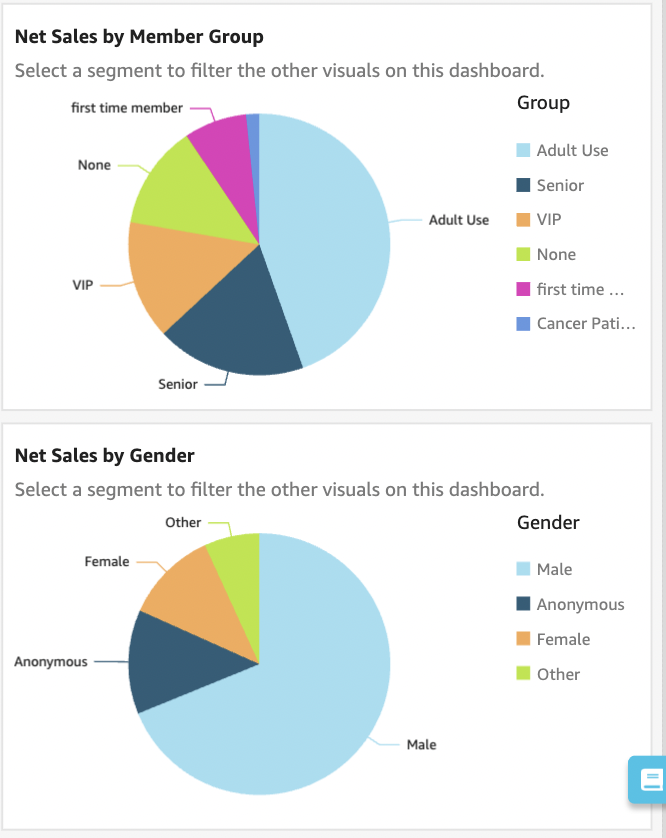
Net Sales By Member Group:
- A breakdown of total revenue generated by each distinct membership group.
-
Net Sales By Gender:
- A comparison of revenue segmented by the self-reported gender of your members.
-
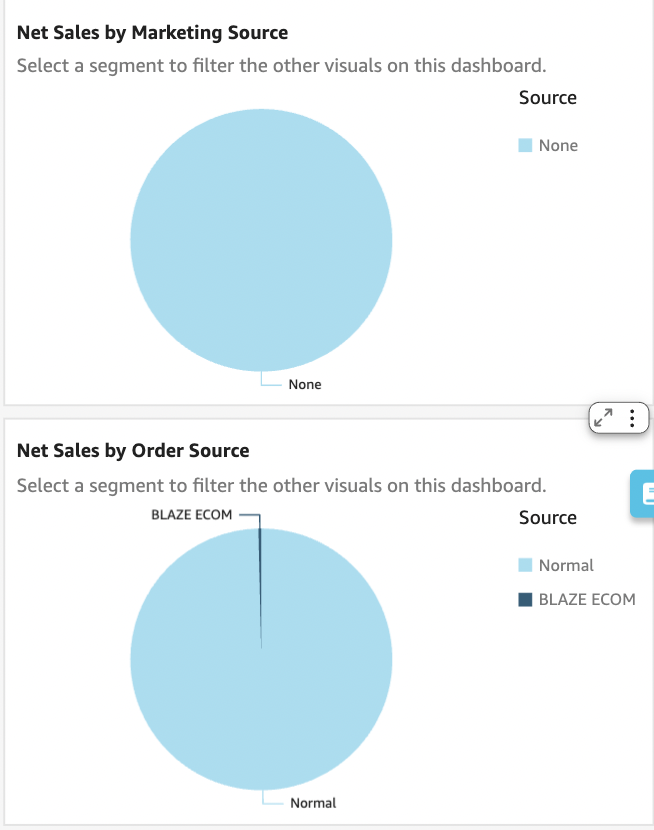
Net Sales By Marketing Source:
- Revenue attributed to specific marketing campaigns or acquisition channels that have been added to marketing sources (e.g., Email, Social Media, Organic).
- Revenue attributed to specific marketing campaigns or acquisition channels that have been added to marketing sources (e.g., Email, Social Media, Organic).
-
Net Sales by Order Source:
-
Total sales categorized by where the origin source of the transaction occurred (e.g., In-Store POS, BLAZE ECOM, Third Party).
-
Charts & Visualizations
-
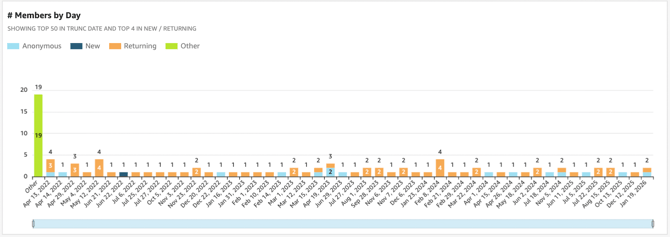
# Members by [Metric]: A visual representation showing the distribution of your member base according to your selected grouping metric.
-
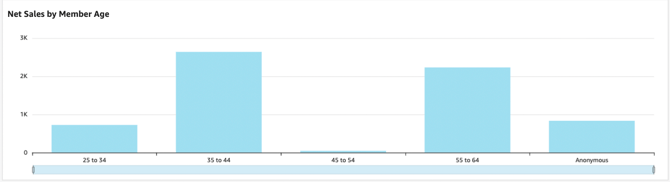
Net Sales by Member Age: A bar or line graph illustrating revenue trends across different age demographics.
Available Reports
-
Members: A comprehensive list of individual members included in the current filtered view, detailing their zip code, date joined, lifetime net sales, total # of transactions, and total units sold.
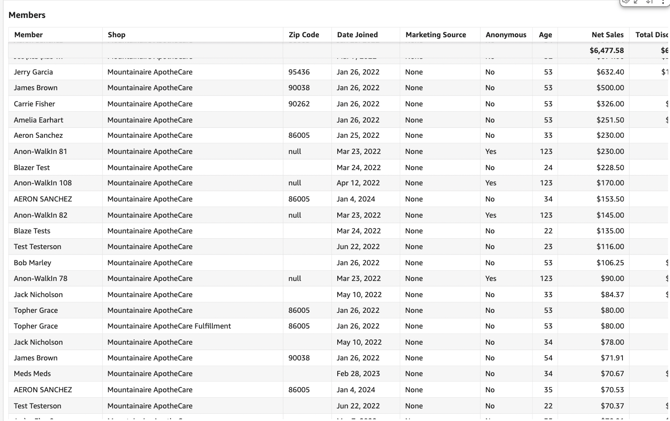
💡 Pro Tip: You can export this or any KPI held in Insights to a CSV or Excel file. Simply click the More Options (three-dot icon) in the upper right-hand corner of the metric.