This guide outlines how to access the report, utilize its filtering tools to segment your data, and accurately interpret the provided metrics and visual charts.
Navigation
To access this report, follow this path in your dashboard:
Insights > Dashboard > Sales > Recommendation Performance
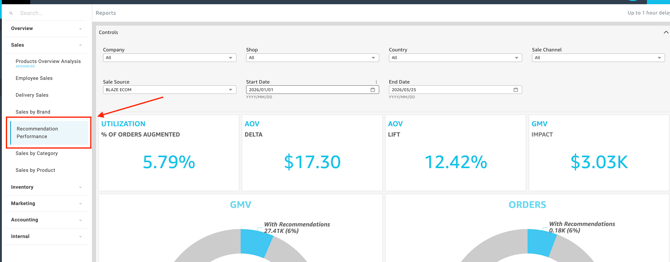
Filtering Report Data
You can customize the data displayed on your dashboard by selecting the following filter options.
Controls:
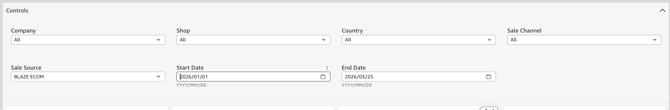
- Company: Select the overarching business entity or organization you wish to analyze (useful if managing a multi-store operators).
-
Shop(s): Select the specific location(s) you want to view.
-
Date: Define the specific timeframe for the report.
- Country: Filter your data by the geographic country where the transaction took place.
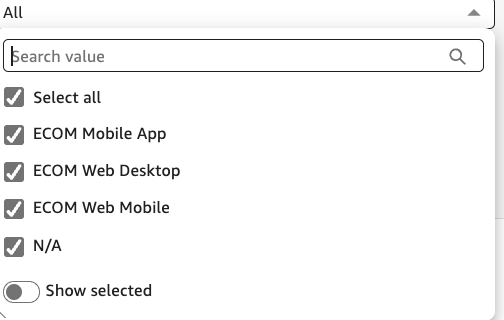
- Sales Channel: Segment your data by the primary business avenue where the purchase occurred. (ECOM Mobile app, ECOM Web Desktop, etc.)
- Sales Source: Specify the exact origin or device of the sale within a channel (e.g., Normal ( Retail), BLAZE ECOM, or Third Party, etc.).
Dashboard Metrics & Reports
The dashboard provides a comprehensive view of your sales through various Key Performance Indicators (KPIs), detailed breakdowns, and visual charts.
Detailed Breakdowns
-
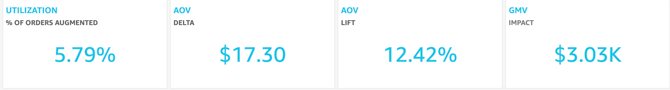
Utilization:
- The percentage of total orders or customers that interacted with and purchased an item from a recommendation widget.
-
AOV Delta:
- The absolute dollar amount difference in Average Order Value (AOV) between orders that included a recommended item and those that did not.
-
AOV Lift:
- The percentage increase in Average Order Value (AOV) directly attributed to customers purchasing recommended items.
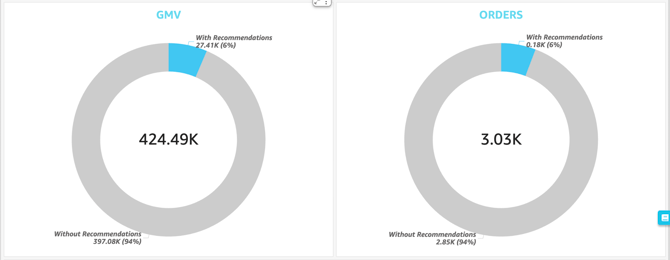
- GMV Impact:
- The total Gross Merchandise Value (GMV) generated specifically from the recommended products during the selected timeframe.
Charts & Visualizations
-
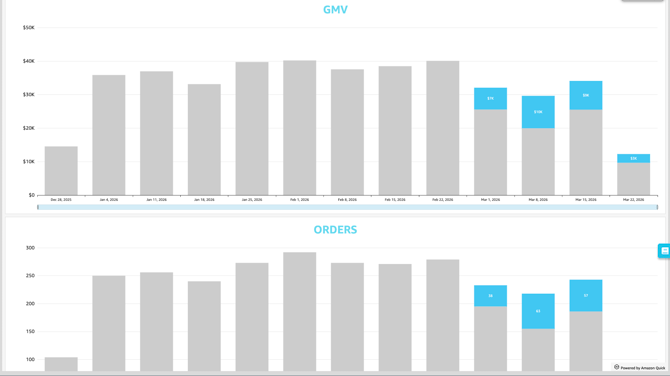
GMV:
- A visual representation of Gross Merchandise Value trends over time, comparing your total sales against the revenue driven specifically by recommendations.
-
Orders:
-
A graphical breakdown of total order volume over your selected date range, highlighting the proportion of orders that contained recommended items.
-
💡 Pro Tip: You can export this or any KPI held in Insights to a CSV or Excel file. Simply click the More Options (three-dot icon) in the upper right-hand corner of the metric.