Navigation
To access this report, follow this path in your dashboard:
Insights > Dashboard > Sales > Sales By Category
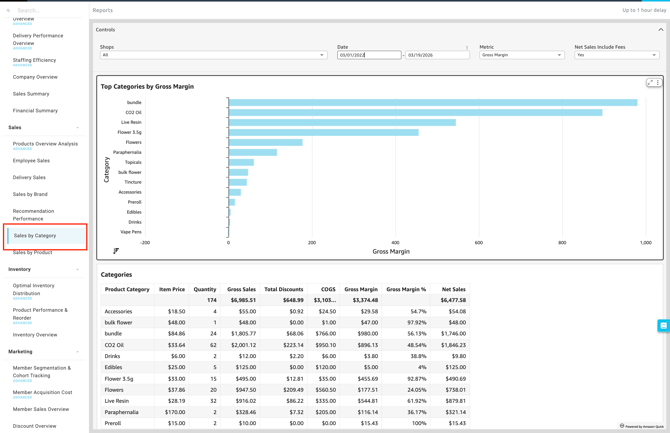
Filtering Report Data
You can easily customize the data displayed on your dashboard to fit your specific needs. Use the following filter controls to narrow down your view.
-
Controls:

-
Shop(s): Select the specific location(s) you want to view.
-
Date: Define the specific timeframe for the report.
-
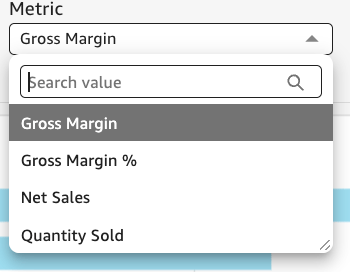
Metric: Filter brands by Gross Margin, Gross Margin %, Net Sales, or Quantity Sold.
-
Net Sales Includes Fees: Toggle between Yes or No to include or exclude fees from the net sales calculation.
-
Available Reports & Charts
-
-
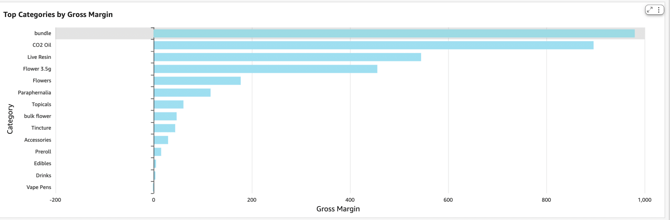
Top Categories by [Metric]: A visual chart highlighting your highest-performing product groupings. This report dynamically updates based on the metric you select (such as Gross Margin or Net Sales), allowing you to quickly identify which types of products are driving the most value within your chosen timeframe.
-
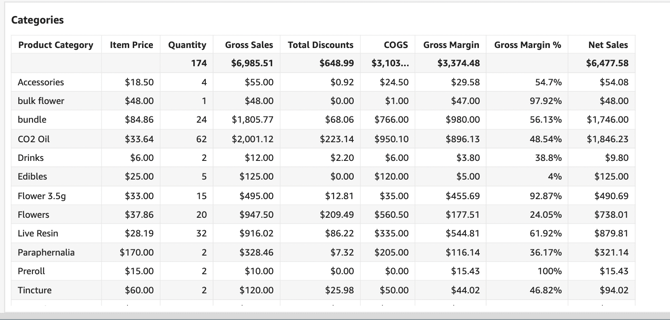
Categories: A comprehensive data table detailing individual performance metrics for every product category sold at your selected locations. This granular breakdown allows you to analyze net sales, total quantity sold, the total discounts applied, cost of goods, gross margin, and gross margin percentage line-by-line to evaluate each category's overall contribution to your bottom line.
-
Please review the terminology found in our Insights Accounting Glossary with your accounting professional and reach out if there are any questions!
💡 Pro Tip: You can export this or any KPI held in Insights to a CSV or Excel file. Simply click the More Options (three-dot icon) in the upper right-hand corner of the metric.