
Add pre-designed graphics to your dashboard by using the Graphic widgets. This allows you to add shapes, arrow lines, or icons, by choosing from a selection of widgets.
Overview
Graphic Widget types
- Shapes: Types of shapes that can be added to the canvas, such as a circle, or a square that you can expand, customize, and use as a border.
- Lines: Types of lines that can be added to the canvas, such as arrows.
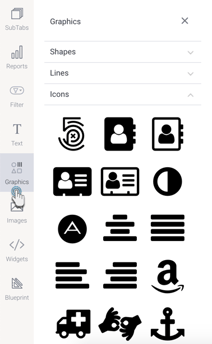
- Icons: Types of icons that can be added to the canvas.
How to use Graphic Widgets
- Click on the Graphics button on the left side of the screen, to expand its panel.
- Expand any of the sections within the panel (such as shape, lines or icons) and drag the selected widget anywhere on the dashboard canvas.
- You can customize a Graphic Widget via its properties panel. This panel appears on the right side once the widget is selected.
- You can also add an action event that will be triggered when this widget is clicked.
- Additional options are available by right-clicking and using the menu that appears.
Graphic properties
The Graphic Widget properties can be used for customization.
NOTE: Properties differ slightly depending on the selected graphic widget type, that is shape, icon or line. The Text properties description has definitions of each property.